| 2023 R'000 |
2023 % |
2022 R'000 |
2022 % |
2021 R'000 |
2021 % |
2020 R'000 |
2020 % |
|||
| VALUE ADDED | ||||||||||
| Value added by operating activities | 2 208 065 | 84.3 | 2 433 050 | 96.8 | 2 036 799 | 97.2 | 2 029 637 | 95.5 | ||
| Revenue | 18 918 263 | 17 806 262 | 18 864 344 | 23 312 162 | ||||||
| Net operating expenses | (16 710 198) | (15 373 212) | (16 827 545) | (21 282 525) | ||||||
| Value added by investing activities | 411 540 | 15.7 | 80 993 | 3.2 | 59 719 | 2.8 | 95 761 | 4.5 | ||
| Interest income | 411 540 | 80 993 | 59 719 | 95 761 | ||||||
| 2 619 605 | 100 | 2 514 043 | 100 | 2 096 518 | 100 | 2 125 398 | 100 | |||
| VALUE DISTRIBUTED | ||||||||||
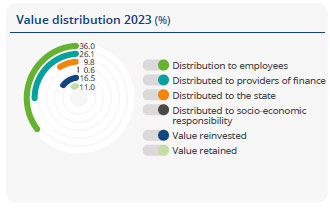
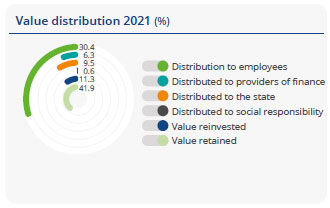
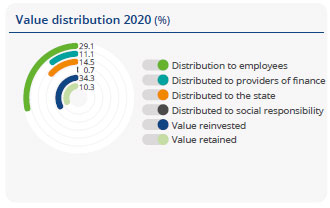
| Distributed to employees | 945 501 | 36.0 | 780 255 | 31.0 | 637 387 | 30.4 | 619 167 | 29.1 | ||
| Salaries, wages, medical and other benefits | 945 501 | 780 255 | 637 387 | 619 167 | ||||||
| Distributed to providers of finance | 682 599 | 26.1 | 201 225 | 8.0 | 131 949 | 6.3 | 236 186 | 11.1 | ||
| Finance costs | 682 599 | 201 225 | 131 949 | 236 186 | ||||||
| Distributed to the state | 257 276 | 9.8 | 226 591 | 9.0 | 200 013 | 9.5 | 307 388 | 14.5 | ||
| Income tax* | 257 276 | 226 591 | 200 013 | 307 388 | ||||||
| Distributed to socio-economic responsibility | 14 914 | 0.6 | 17 548 | 0.7 | 12 052 | 0.6 | 14 584 | 0.7 | ||
| Socio-economic development | 14 914 | 17 548 | 12 052 | 14 584 | ||||||
| Value reinvested | 431 142 | 16.5 | 196 427 | 7.8 | 237 101 | 11.3 | 728 968 | 34.3 | ||
| Depreciation, amortisation and impairment | 121 164 | 110 798 | 181 113 | 750 754 | ||||||
| Reversal of impairment of investment in associate | (962 531) | — | — | — | ||||||
| Share of losses/(profits) of associates and joint ventures | 1 329 747 | (8 042) | (2 951) | (13 640) | ||||||
| Deferred taxation | (57 238) | 93 671 | 58 939 | (8 146) | ||||||
| Value retained | 288 173 | 11.0 | 1 091 997 | 43.5 | 878 016 | 41.9 | 219 105 | 10.3 | ||
| Retained profit | 268 966 | 1 027 079 | 830 607 | 124 481 | ||||||
| Minority shareholders' interest | 19 207 | 64 918 | 47 409 | 94 624 | ||||||
| 2 619 605 | 100 | 2 514 043 | 100 | 2 096 518 | 100 | 2 125 398 | 100 |
| * | Income tax relates to corporate taxes paid in terms of the Income Tax Act. |

Blue Label Telecoms Integrated Annual Report 2023