| 2023 R'000 |
2022 R'000 |
2021 R'000 |
2020 R'000 |
2019 R'000 |
2018 R'000 |
2017 R'000 |
2016 R'000 |
2015 R'000 |
2014 R'000 |
||
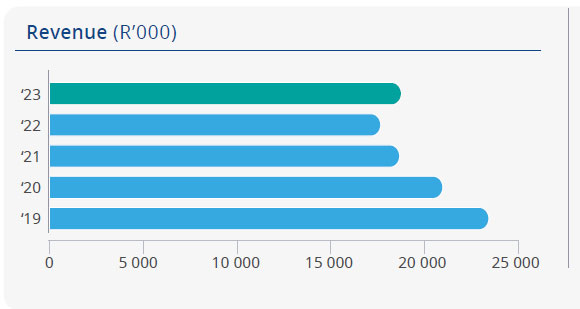
Revenue |
18 918 263 | 17 806 262 | 18 821 290 | 21 135 326 | 23 602 264 | 26 734 249 | 26 469 581 | 26 204 722 | 22 044 222 | 19 401 666 | |
|---|---|---|---|---|---|---|---|---|---|---|---|
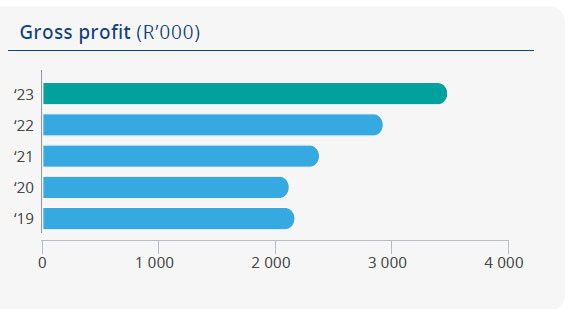
Gross profit |
3 483 075 | 2 930 974 | 2 383 254 | 2 124 611 | 2 173 686 | 2 282 092 | 2 129 000 | 1 829 694 | 1 644 340 | 1 349 534 | |
GP (%) |
18.41 | 16.46 | 12.66 | 10.05 | 9.21 | 8.54 | 8.04 | 6.98 | 7.46 | 6.96 | |
EBIT |
1 126 4861 | 1 524 449 | 1 171 390 | 636 050 | 86 845 | 1 097 549 | 1 174 890 | 1 142 376 | 986 146 | 722 856 | |
EBITDA |
1 316 9261 | 1 698 494 | 1 360 273 | 825 364 | 257 300 | 1 340 153 | 1 287 741 | 1 240 559 | 1 080 165 | 787 993 | |
Net profit from continuing operations attributable to the parent |
268 9661 | 1 027 079 | 805 286 | 226 786 | (6 672 923) | 1 122 085 | 781 254 | 691 590 | 577 617 | 450 230 | |
Cash generated from/(utilised in) operating activities |
501 843 | 648 769 | 1 468 042 | 1 256 825 | (80 514) | 3 188 144 | 1 361 959 | 432 942 | 132 495 | 907 332 | |
Cash and cash equivalents |
1 302 767 | 2 723 528 | 2 417 207 | 2 014 725 | 1 377 753 | 947 888 | 1 350 666 | 589 027 | 788 411 | 1 184 131 | |
Capital expenditure paid during the financial year |
1 055 307 | 1 091 147 | 107 918 | 170 523 | 209 959 | 102 823 | 113 280 | 127 131 | 178 684 | 149 089 | |
| Ratios | |||||||||||
EPS (cents) |
30.48 | 117.13 | 94.55 | 13.89 | (727.81) | 131.13 | 114.13 | 103.85 | 86.86 | 67.88 | |
HEPS (cents) |
41.97 | 117.34 | 86.16 | 58.16 | (312.49) | 130.44 | 114.19 | 100.35 | 82.26 | 67.98 | |
Core HEPS (cents) |
45.55 | 121.01 | 89.65 | 62.71 | (304.77) | 135.62 | 116.24 | 102.85 | 85.11 | 69.54 | |
NAV per share (cents) |
473.69 | 447.41 | 350.05 | 267.13 | 259.31 | 988.70 | 730.63 | 662.32 | 578.87 | 524.40 | |
Dividends declared per share (cents) |
— | — | — | — | — | — | 40* | 36* | 31* | 27* | |
Dividend cover on headline earnings |
— | — | — | — | — | — | 2.23* | 2.75* | 2.62* | 2.48* | |
Weighted average number of shares ('000) |
882 530 | 876 857 | 878 463 | 896 409 | 913 208 | 855 687 | 684 508 | 665 950 | 665 030 | 663 298 | |
Number of employees at year-end – subsidiaries |
1 412 | 1 566 | 2 505 | 922 | 1 111 | 874 | 796 | 776 | 1 305 | 1 176 |
| * | Gross ordinary dividend. |
| 1 | Refer to the Financial Director's report for non-recurring income in FY23 included in EBITDA, EBIT and net profit attributable to the parent. |
Blue Label Telecoms Integrated Annual Report 2023