Ten-year review
| 2021 R’000 |
2020 R’000 |
2019 R’000 |
2018 R’000 |
2017 R’000 |
2016 R’000 |
2015 R’000 |
2014 R’000 |
2013 R’000 |
20121 R’000 |
||
|---|---|---|---|---|---|---|---|---|---|---|---|
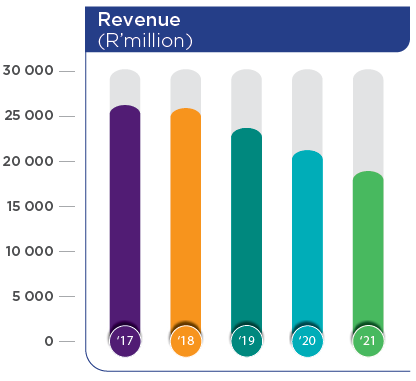
| Revenue | 18 821 290 | 21 135 326 | 23 602 264 | 26 734 249 | 26 469 581 | 26 204 722 | 22 044 222 | 19 401 666 | 18 984 210 | 18 722 080 | |
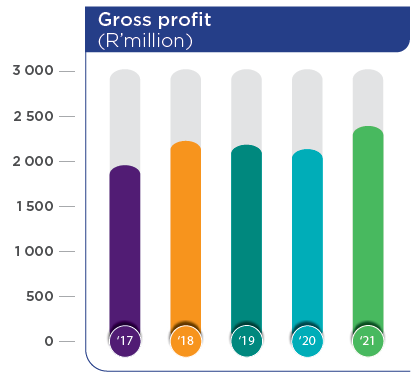
| Gross profit | 2 383 254 | 2 124 611 | 2 173 686 | 2 282 092 | 2 129 000 | 1 829 694 | 1 644 340 | 1 349 534 | 1 271 245 | 1 208 077 | |
| Gross profit (%) | 12.66 | 10.05 | 9.21 | 8.54 | 8.04 | 6.98 | 7.46 | 6.96 | 6.70 | 6.45 | |
| EBIT | 1 171 3902 | 636 0502 | 86 845 | 1 097 549 | 1 174 890 | 1 142 376 | 986 146 | 722 856 | 645 671 | 643 828 | |
| EBITDA | 1 360 2732 | 825 3642 | 257 300 | 1 340 153 | 1 287 741 | 1 240 559 | 1 080 165 | 787 993 | 713 622 | 735 385 | |
| Net profit from continuing operations attributable to the parent | 805 2862 | 226 7862 | (6 672 923) | 1 122 085 | 781 254 | 691 590 | 577 617 | 450 230 | 424 841 | 438 104 | |
| Cash generated from/(utilised in) operating activities | 1 468 042 | 1 256 825 | (80 514) | 3 188 144 | 1 361 959 | 432 942 | 132 495 | 907 332 | (439 794) | 528 109 | |
| Cash and cash equivalents | 2 417 207 | 2 014 725 | 1 377 753 | 947 888 | 1 350 666 | 589 027 | 788 411 | 1 184 131 | 941 282 | 1 975 242 | |
| Capital expenditure | 107 918 | 170 523 | 209 959 | 102 823 | 113 280 | 127 131 | 178 684 | 149 089 | 291 605 | 164 485 | |
| Ratios | |||||||||||
| EPS (cents) | 94.55 | 13.89 | (727.81) | 131.13 | 114.13 | 103.85 | 86.86 | 67.88 | 64.22 | 61.87 | |
| HEPS (cents) | 86.16 | 58.16 | (312.49) | 130.44 | 114.19 | 100.35 | 82.26 | 67.98 | 64.17 | 64.65 | |
| Core HEPS (cents) | 89.65 | 62.71 | (304.77) | 135.62 | 116.24 | 102.85 | 85.11 | 69.54 | 66.08 | 67.15 | |
| NAV per share (cents) | 350.05 | 267.13 | 259.31 | 988.70 | 730.63 | 662.32 | 578.87 | 524.40 | 480.77 | 432.08 | |
| Dividends declared per share (cents) | – | – | – | – | 40* | 36* | 31* | 27* | 25* | 23* | |
| Dividend cover on headline earnings | – | – | – | – | 2.23 | 2.75 | 2.62 | 2.48 | 2.52 | 2.95 | |
| Number of employees at year-end - subsidiaries | 2 5053 | 922 | 1 111 | 874 | 796 | 776 | 1 305 | 1 176 | 1 112 | 1 216 | |
| * | Gross ordinary dividend. |
| 1 | Includes a once-off income receipt of R79.4 million. |
| 2 | Refer to Financial Director’s report for non-recurring income in FY2021 and extraneous costs in FY2020 included in EBITDA, EBIT and net profit attributable to the parent. |
| 3 | The largest contributor to the growth in employees was due to appointments at semiskilled level. |